Financial Reporting, Financial Statement Audit, NetSuite
3 min Read
Are you an accountant looking to get more from your NetSuite instance? Consider taking my saved search course for accountants. Enroll today and take the course anytime!
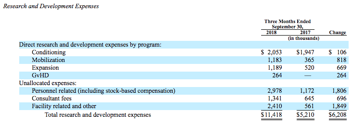
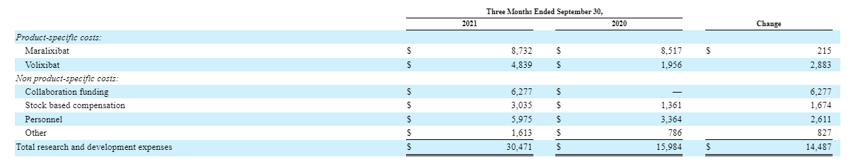
One primary benefit of NetSuite is the ability to build custom reports to ease reporting requirements. This article will discuss using the Financial Report builder to prepare the direct research and development (R&D) spend table in NetSuite. The direct R&D spend table is required for publicly-traded biotech organizations making 10-K and 10-Q filings with the SEC. See below for an example:
Before starting, I’m assuming that:
-
The Department segment tracks General and Administrative (G&A) vs. R&D expenses.
-
The Class (commonly renamed to Product or Program) tracks program expenses.
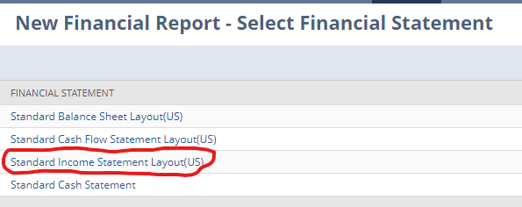
To start, navigate to Reports -> New Financial Report and select the “Standard Income Statement” layout.
 We want to clear out the standard income statement template. To do this, navigate to the left side of the screen and click each row. Once the row is selected, click the gray ‘X’ button to remove the row.
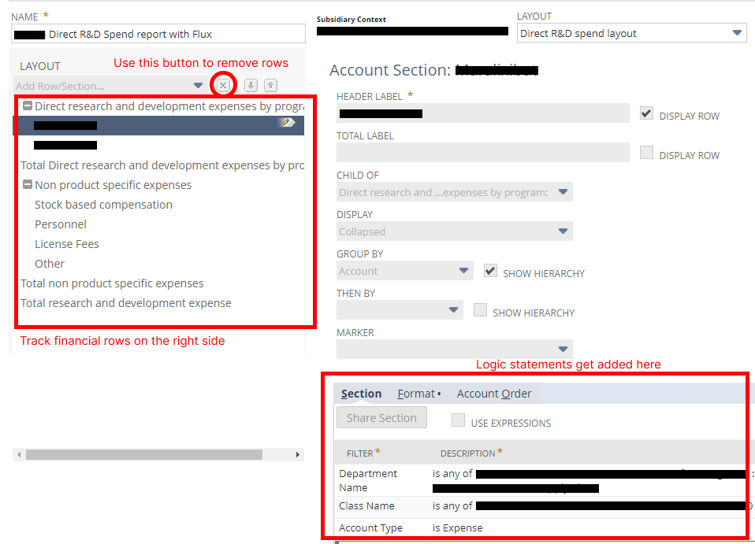 After removing the income statement rows, we can add the rows required for the direct R&D spend table. First, we want to add the “Product-specific costs:” section. To do this, select the ‘Add Header and Summary Rows’ from the Layout drop-down. Then, we want to add a row for each named program’s spending.
The logic for each section will depend on how you calculate these amounts. For example, a typical formula statement might be:
-
Department Name set to all of the R&D departments. This statement ensures that we only include R&D spending.
-
Class Name set to all of the products applicable to the product row. This statement might include a single product segment value or multiple product values.
-
Account Type set to Expense and Cost of Goods Sold account types.
In addition, for each row, select:
-
Select “Product-specific costs” as the Child of the row.
-
Under the format section, you might need to check the “Reverse Sign.”
-
You can select the data to group by account, Class, or department for internal reporting purposes. For example, I like to use Department and Account.
After adding the Product specific rows, you would follow the same logic for the Non-product-specific rows. Finally, add a formula row at the bottom of the report for the Total R&D expense line.
A few final considerations:
-
The best way to confirm the report is working is to tie the total R&D expense line to the R&D line on your SEC income statement.
-
As you add new segment values, you will need to update the logic statements for each row manually. I’d recommend adding an automated saved search to remind you of new segments created each quarter to catch these. Here is an article on how to build such a report.
-
You can make this a standard template and create multiple reports with different columns. For example, combinations might include QTD vs. prior year QTD and YTD vs. prior YTD, etc.
Once this report is finalized and tied out, you can quickly add this table to your 10-K and 10-Q filing. Adding this automated report will streamline the financial reporting process by leveraging technology. If you need assistance with reporting needs in NetSuite, subscribe to my newsletter and contact us today!